
RoboMiri Update: Creating Simple HTTP Uptime Monitor

 RoboMiri comes with a very easy way to create your own HTTP Uptime Monitor. 


What is an HTTP Monitor?


An HTTP Monitor is a type of uptime monitor that lets you know when a webpage or a website is down. It sends a scheduled request to your page and waits for an answer in a given timeframe, also known as timeout. If the response is received, the monitor is marked as UP, otherwise it is marked as DOWN. To be less time-consuming, usually, the monitoring service is sending a HEAD request. For some special cases, like checking the response headers, it can also send a GET request.

How RoboMiri does do this?

RoboMiri is following the same principle. First, it sends a HEAD request to your webpage and waits for a response. If it gets the response, then the monitor is marked as UP and the response time is saved in order to create a statistic with it, so you can see how long your webpage is taking to respond. 

The main server of RoboMiri is based in London, so it measures the response time from London.

If the webpage is not responding to the first request (our requests are blocked by a proxy or firewall or the webpage is really down), RoboMiri is sending the monitor to another checker that is based on Ireland on another network. This checker is doing again the same check and, if it also does not receive the message, it marks the monitor DOWN. When the monitor is marked as DOWN, RoboMiri saves the error code and message and sends a notification to all configured notifications for that monitor (voice call, sms, email or webhook).

If the monitor is marked as down and at the next check is also down, no notifications will be sent in order to save user notifications (if there are paid notifications like voice call or sms).

If the monitor is up again, RoboMiri sends a notification in which it lets you know that the monitor is up and for how long it was down.


How to create a Http Uptime Monitor?


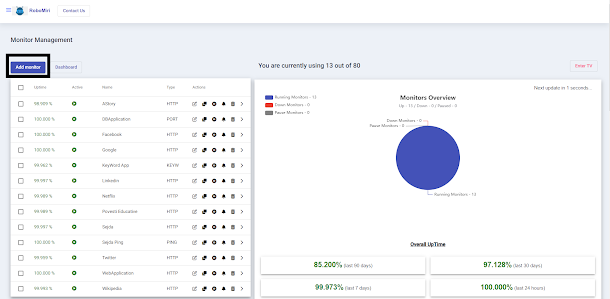
RoboMiri offers the simplest way to create an uptime monitor. After login, just go to dashboard and click Add Monitor.


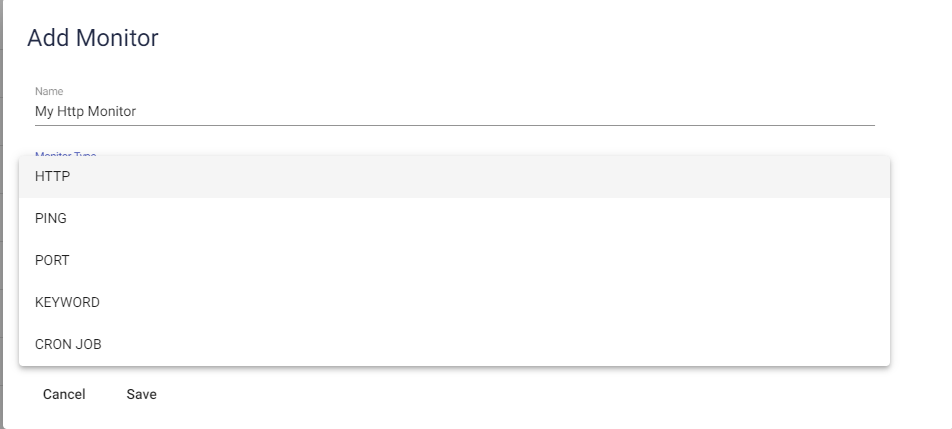
A modal will appear with monitor details. From there, add a Monitor Name and on Monitor Type field, choose HTTP.


On the next step, complete your website url to monitor on Url (or IP) field.


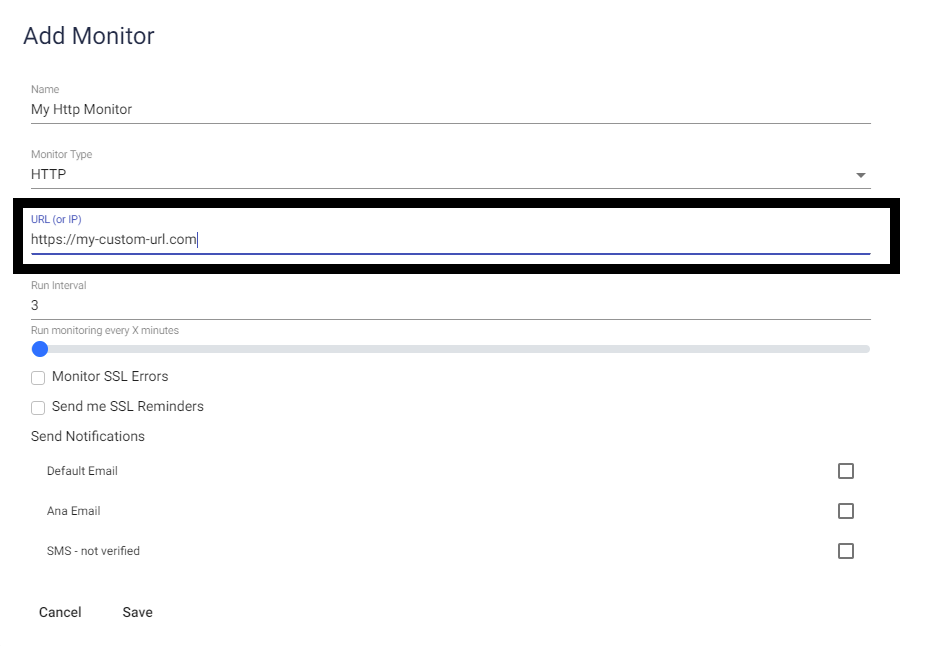
If you need, configure some other fields, like Run Interval or Notifications to send and press Save.


And that’s it, your monitor is now up and running.


P.S. If you have any requirements or suggestions, just let us know in comments.


Comments

Popular posts from this blog

RoboMiri Update: Creating Simple Keyword Uptime Monitor

  RoboMiri comes with a very easy way to create your own Keyword Uptime Monitor.  What is a Keyword Monitor? A Keyword Monitor is a type of uptime monitor that lets you search on a page for the existence or inexistence of a given single or multiple words. It sends a scheduled ping to your service and waits for an answer in a given timeframe, also known as a timeout. If the ping can resolve, the monitor is marked as UP, otherwise, it is marked as DOWN. How RoboMiri does do this? RoboMiri is following the same principle. First, it sends a ping request to your server and waits for a successful connection. If it gets the connection, then the monitor is marked as UP and the response time is saved in order to create a statistic with it, so you can see how long your server is taking to respond.  The main server of RoboMiri is based in London, so it measures the response time from London. If the monitored service is not responding to the first ping request (our requests are blocked b

Website Down?

When a website goes down, it can be a frustrating and stressful experience for both the website owner and its users. Website downtime can lead to lost revenue, customer frustration, and a damaged reputation for the business. In this article, we'll explore the causes of website downtime, the impact it can have on a business, and how to prevent and minimize downtime. Causes of Website Downtime There are many potential causes of website downtime, including: Server issues : The server that hosts a website can experience problems such as hardware failures, software bugs, or network connectivity issues, which can cause the website to go down. Cyber attacks : Websites can be targeted by hackers or malicious individuals who try to take the website offline through a variety of means, such as distributed denial of service (DDoS) attacks or malware infections. Human error : Website downtime can also be caused by mistakes made by website owners or administrators, such as accidentally deleting

What is Cron Job Monitoring?

Cron jobs are automated tasks that are run on a schedule, and they are a common way to automate processes on a Linux or Unix-based system. Cron job monitoring is the process of ensuring that these automated tasks are running correctly and on schedule. There are several reasons why cron job monitoring is important. First, cron jobs are often used to perform critical tasks such as backing up data or processing transactions. If a cron job fails to run or runs improperly, it can lead to lost data or financial losses. Second, cron jobs can fail for a variety of reasons, such as system errors, permissions issues, or conflicts with other tasks. Monitoring cron jobs allows you to identify and troubleshoot these issues before they cause problems. There are several tools and services available for monitoring cron jobs. These tools can track the status of cron jobs, alert you if a job fails to run or runs improperly, and provide logs and other data to help you diagnose problems. Some tools even a